
SOPHIA OLISE
 Data Analysis
 0 comment
 03 Oct, 2025
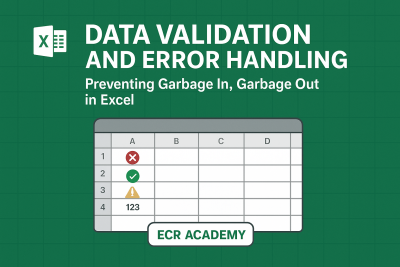
In the world of data analysis, one principle reigns supreme: "Garbage In, Garbage Out" (GIGO). If your Excel sheet is fed poor-quality, inconsistent, or incorrect data, the resulting insights, dashboards, and strategic decisions will be fundamentally flawed and unreliable. To maintain the integrity of your analysis, mastering data validation and error handling in Excel is non-negotiable.
These techniques ensure your data is clean, accurate, and trustworthy at the point of entry, significantly reducing the tedious, time-consuming data cleaning phase later on.
For professional analysts and businesses, especially those dealing with localized Nigerian datasets, the implementation of validation and error checks provides crucial benefits:
Data Validation is Excel's mechanism for enforcing rules on what can be typed into a cell. This is typically done via the Data tab > Data Tools > Data Validation.
Whole Numbers/Decimals: Limit sales figures to positive numbers only (Settings > Allow: Whole number > Data: greater than 0).
Text Length: Restrict employee IDs or phone numbers to a specific number of characters.
Date Controls: Ensure all date entries fall within a valid operational range (e.g., only dates from the current financial year).
2. Create Drop-Down Lists (List Validation): This is the most effective tool for consistency. By defining a list of acceptable entries (e.g., 'North', 'South', 'East', 'West'), you completely prevent typos and spelling variations in critical category fields like region or department.
3. Custom Rules with Formulas: Use logical formulas to enforce complex relationships. For example, you can use a formula to ensure that a Discount Percentage cell is never greater than the value in the Sales Amount cell.
4. Input/Error Messages: Customize the messages users see:
Input Message: Displays a friendly note when the user selects the cell (e.g., "Please enter the amount in Naira").
Error Alert: Pops up when the user violates the rule (e.g., "STOP: Sales cannot be a negative value!").
While validation blocks entry errors, error handling manages calculation failures and identifies unusual outliers after data is entered.
Bad data inevitably leads to bad results, distorting key metrics and undermining trust in your analysis. By integrating the discipline of data validation and robust error handling into your Excel workflow, you ensure your analysis is not only accurate but professionally verifiable. Mastering these foundational skills will set you apart from general Excel users.
Ready to build reliable, trustworthy data models?
At ECR Academy, Umuahia, Abia State, we teach the core discipline of data integrity alongside advanced formulas. Join our practical Excel for Data Analysis training today and learn how to proactively prevent GIGO, making your insights immediately more reliable and valuable to employers.
It means that incorrect data leads to unreliable results, no matter how good your formulas or dashboards are.
Go to Data > Data Validation > List, then enter your options (e.g., “East, West, North, South”).
Yes, Excel applies validation rules across entire columns or ranges for big datasets.
Validation prevents wrong data entry, while error handling fixes or flags errors after they occur.
Yes, our Excel training covers data validation, error handling, and dashboard creation for real business problems.
SOPHIA OLISE
Data Analyst
Olise Sophia Amarachi is a passionate and purpose-driven data analyst and digital skills advocate based in Nigeria. With a strong foundation in Excel, Power BI, and SQL, she empowers others—especially young people and corps members—through practical training, tech mentorship, and values-based leadership. Sophia’s journey into data analysis began during her NYSC year in Abia State, where she committed herself to learning and growing from scratch. Today, she shares her knowledge through online classes, challenges, and hands-on projects, including dashboards and reports that translate complex data into clear insights.
0 comment